
How to Track Google Maps Rankings Across an Area With Geo-Grid Rank Tracking

Freelancer Tawhid
SEO Expert and Consultant
- October 12, 2026
- No Comments
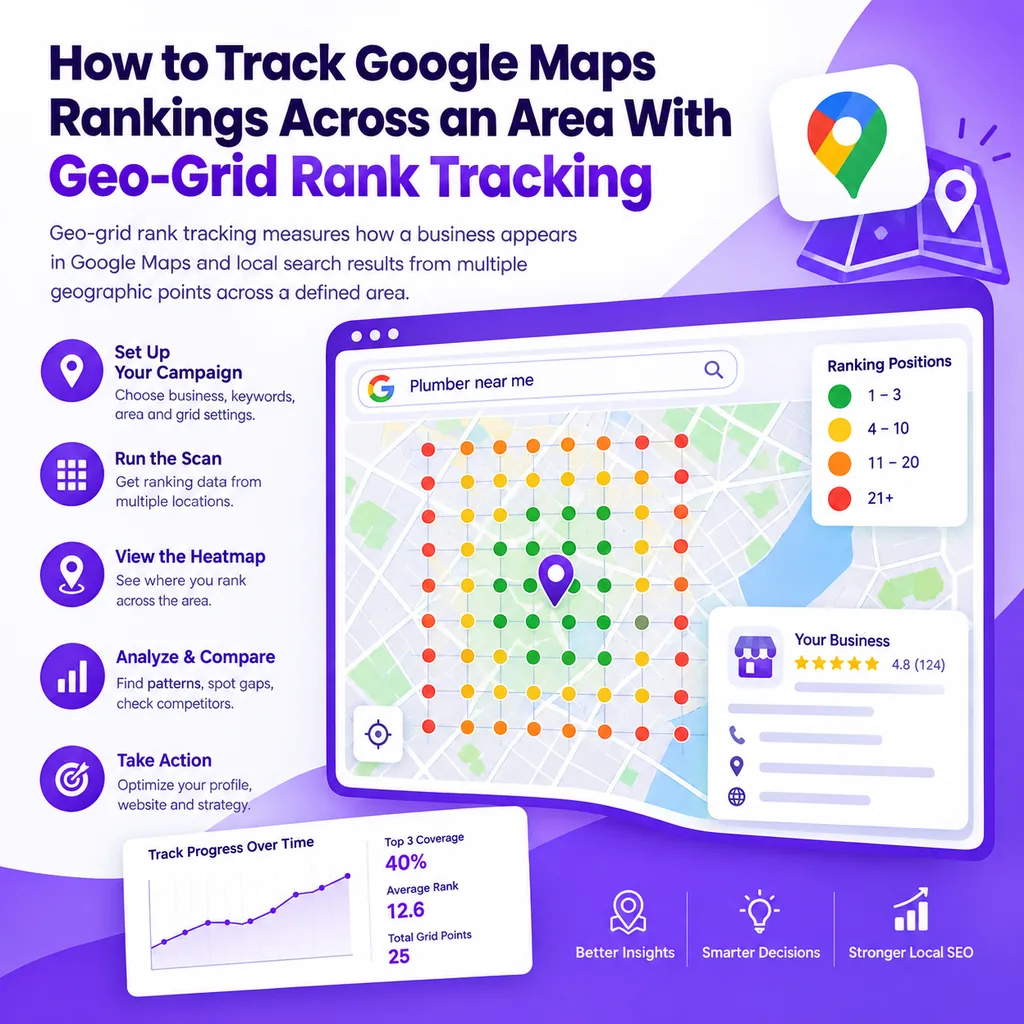
Geo-grid rank tracking measures how a business appears in Google Maps and local search results from multiple geographic points across a defined area. Instead of relying on a single ranking check, you can use a grid of locations to identify where visibility is strong, where rankings decline, how competitors perform, and which areas deserve further investigation.
For local businesses, ranking first in one location does not necessarily mean ranking well throughout the surrounding market. Search results can vary depending on the searcher’s location, the relevance of the query, and the prominence of competing businesses.
A geo-grid rank tracker helps reveal these geographic differences so you can make more informed Local SEO decisions.
In this guide, you’ll learn how geo-grid rank tracking works, how to configure a tracking campaign, how to interpret ranking heatmaps, which metrics matter, and how to use the findings to improve your local search strategy.
What Is Geo-Grid Rank Tracking?
Geo-grid rank tracking is a Local SEO measurement method that checks a business’s search ranking from multiple geographic points arranged in a grid.
Each point represents a specific search location. A tracking tool records the business’s ranking for a selected keyword at each point and visualizes the results on a map.
This creates a geographic picture of local search visibility rather than a single ranking number.
For example, a home repair company might rank prominently near its business location but appear much lower in other parts of its service area. A geo-grid can reveal that pattern and help the company investigate where its visibility is weaker.
How Does a Geo-Grid Work?
A typical geo-grid tracking process follows six steps:
- Select the business location or Google Business Profile you want to monitor.
- Choose the search keywords that matter to the business.
- Set the geographic center, grid size, and scan radius.
- Run the ranking scan for the selected search queries.
- Review the recorded positions at individual grid points.
- Compare the results over time to identify changes in visibility.
The results are generally displayed as colored markers on a map. Each marker corresponds to a sampled location, with its color representing a ranking range defined by the tracking platform.
The exact settings and available metrics depend on the tool.
Geo-Grid Tracking vs. Traditional Rank Tracking
Traditional rank tracking can provide a useful ranking measurement from a configured search location. However, a single measurement may not represent how a business appears across a wider geographic area.
Geo-grid tracking adds a location-based perspective.
Measurement method | What it shows | Main limitation |
Single-location rank tracking | Ranking position from a particular search location | May not represent visibility throughout the market |
Geo-grid rank tracking | Ranking distribution across multiple geographic points | Covers sampled points, not every possible search location |
Google Business Profile Performance | Available profile discovery and customer interaction data | Does not provide a geographic ranking grid |
These methods answer different questions. Using them together gives you a broader understanding of search visibility and customer engagement.
Google Maps Rankings vs. Local Pack Rankings vs. Organic Rankings
These terms are related, but they should not be treated as interchangeable.
Google Maps rankings refer to a business’s position in results within Google Maps.
Local Pack rankings refer to local business results displayed within Google Search.
Organic rankings refer to conventional website results, such as service pages and blog posts.
A tracking platform may support different search surfaces or reporting options. Before interpreting a report, confirm exactly what the tool measured.
This distinction matters when comparing reports from different platforms or evaluating a change in visibility.
Why Do Google Maps Rankings Vary Across an Area?
Google explains that local results are primarily influenced by relevance, distance, and prominence. These factors help determine which businesses are appropriate matches for a search. You can review the official explanation in Google’s guidance on improving local rankings.
Geo-grid rank tracking helps you understand how local visibility is distributed across geographic locations, but it does not reveal Google’s exact ranking calculations.
1. Distance From the Searcher
Distance is one reason a business may rank differently depending on where someone searches.
Imagine a plumbing company that operates from one physical location. Its visibility may be stronger near that location and weaker farther away, even when the company serves the broader area.
This does not automatically indicate an SEO problem. The observed pattern may partly reflect how proximity influences local results.
A geo-grid helps you see where this geographic variation occurs.
2. Relevance to the Search Query
Google needs to determine how well a business matches the searcher’s intent.
Consider two hypothetical searches:
- Emergency drain repair
- General plumbing services
A plumbing company may be more relevant to one query than another, depending on its services, business information, and the competing results.
For this reason, tracking only one broad keyword can leave important visibility differences undiscovered.
3. Prominence and Competition
Prominence concerns how well-known a business is. Google’s published guidance identifies information such as links and reviews among the factors that can contribute to prominence.
Competitor activity also matters. Other businesses may have stronger relevance to a particular query, greater prominence, or a more advantageous geographic position.
A geo-grid can reveal where competitors appear above your business. Further investigation is needed to understand the possible reasons.
4. Search and Measurement Conditions
Differences in the selected keyword, grid center, search surface, or tool settings can also affect reported results.
A change between two reports does not necessarily mean the business experienced a genuine ranking improvement or decline.
Before drawing conclusions, check whether the scans used comparable configurations and measurement methods.
Important: A geo-grid is a diagnostic tool, not a complete explanation of Google’s algorithm. Use its results to identify patterns and guide further investigation rather than assuming that one observation proves a specific ranking cause.
How to Track Google Maps Rankings With a Geo-Grid: Step by Step
You do not need to track every possible keyword or scan every part of a large geographic area. The goal is to collect enough relevant data to answer a defined business question.
Follow this workflow to establish a useful baseline.
Step 1: Define Your Business and Tracking Objective
Start by deciding what you want to measure.
Your objective might be to:
- Understand Google Maps visibility for an important service.
- Investigate weak rankings in part of a service area.
- Compare local visibility with competing businesses.
- Evaluate whether visibility has changed after legitimate optimization work.
- Establish a recurring measurement process for a single location or multiple locations.
Select the correct business listing and make sure the tracking setup reflects the business’s actual operating model.
A business with several physical locations may need separate tracking configurations for each location. A service-area business should focus on the geography relevant to its genuine customers and operating model.
Do not choose a large radius simply because it looks more comprehensive. Start with a clear question that the scan needs to answer.
Step 2: Choose the Right Keywords to Track
Keyword selection determines what your grid measures.
Focus on search queries that represent genuine customer needs and commercially meaningful services.
A useful starting framework includes:
Keyword category | Example | Purpose |
Branded | [business name] | Examine visibility for searches containing the business name |
Core category | plumber | Measure visibility for the main business category |
Service-specific | emergency drain repair | Assess visibility for an important service |
Relevant local variation | plumber in [service area] | Measure a genuine location-modified query where appropriate |
These are examples of keyword types, not recommendations to track every variation.
Choose queries based on customer intent, actual services, search demand where known, and the decisions you need to make.
Avoid loading a campaign with dozens of near-identical keywords just to generate more data. A smaller, carefully selected keyword set may be more useful than a large list that does not support clear decisions.
For a more structured approach, use relevant principles from my local keyword research service.
Step 3: Choose a Geo-Grid Tracking Tool
Select a tool that supports the search surface, geographic coverage, reporting metrics, and comparison features you need.
Two examples are Local Falcon and BrightLocal Local Search Grid. Both publish documentation explaining how their grid-based tracking features work.
Before choosing a platform, check its current documentation to understand its definitions of grid size, radius, ranking depth, missing positions, and visibility metrics.
The most suitable tool is the one that provides useful, consistent evidence at a cost appropriate to your campaign.
Step 4: Set the Grid Center and Radius
The grid center determines the reference location for the scan. The radius determines how far the outermost grid points extend from that center.
Your configuration should reflect the market being investigated.
For example:
- A compact, densely competitive area may require a smaller radius.
- A more dispersed market may require a wider scan.
- A multi-location business may need separate scans to understand visibility around each location.
- A service-area business may need to select points based on relevant customer geography.
A wider radius covers more ground but may include places that are not meaningful to the business.
Similarly, a very narrow radius may miss the geographic visibility differences you intended to investigate.
Local Falcon’s documentation on map scan radius and grid size explains how these settings affect the area and detail of a scan. Its available configurations are platform-specific, so check the settings in the tool you use.
Step 5: Choose the Grid Size
Grid size determines how many points are sampled.
Common grid configurations include:
Grid configuration | Number of points before exclusions | General use |
3 × 3 | 9 | Small initial test |
5 × 5 | 25 | Basic geographic assessment |
7 × 7 | 49 | More detailed sampling |
9 × 9 | 81 | Broader visibility analysis |
11 × 11 | 121 | Higher-resolution assessment |
These figures are examples, not universal recommendations. Available grid sizes vary by platform, and excluding irrelevant points can reduce the number of actual measurements.
More points can reveal finer geographic patterns. However, they can also increase the cost of recurring scans.
Start with a configuration that answers your main question. Increase the grid density when the additional detail is likely to influence a decision.
Step 6: Standardize Your Tracking Settings
Before running the scan, record the important configuration details.
Include:
- The business or profile being tracked.
- The exact keyword.
- The search surface being measured.
- The grid center.
- The radius and grid size.
- The date of the scan.
- The ranking depth and treatment of results outside that depth.
- Any excluded grid points.
- Relevant tool-specific settings.
Keep these details consistent when tracking changes over time.
If you change the radius, keyword, or grid size between reports, you may be comparing different measurement conditions rather than a genuine change in local visibility.
Step 7: Run a Baseline Scan
A baseline gives you a starting point for comparison.
Run your initial scan and inspect the results before implementing significant changes.
Record the ranking positions, the geographic distribution of strong and weak points, and the competitors appearing in important areas.
Check whether the configuration covers the market you intended to measure. If the results suggest that the radius is too broad or the grid misses relevant locations, adjust the settings and establish an appropriate baseline before starting recurring monitoring.
Local Falcon’s scan-setting guide recommends using one or two baseline scans to help determine appropriate recurring settings.
If you are comparing different configurations during setup, keep their results separate. Do not interpret a change caused by a different measurement area as an improvement in rankings.
Step 8: Review the Results and Identify Priorities
Once the scan is complete, do not focus exclusively on the overall ranking number.
Ask:
- Where does the business appear most prominently?
- Where do rankings decline?
- Are the weaker points concentrated in a particular part of the grid?
- Which competitors appear in those locations?
- Do the results vary by keyword?
- Are the findings consistent with the business’s real service area and customer needs?
Use these observations to decide what needs closer investigation.
The objective is not simply to produce a heatmap. It is to turn the data into a practical set of questions and actions.
How to Choose the Right Geo-Grid Radius, Grid Size, and Scan Frequency
There is no single configuration that suits every business. The best settings depend on the size of the relevant market, population density, competitive conditions, tracking budget, and level of detail required.
Choosing the Right Radius
A radius that is too small may show strong visibility near the business while missing important weaknesses elsewhere.
A radius that is too large may introduce many locations that have little practical relevance and make the results harder to interpret.
Choose a radius that reflects the question you are investigating. For example, a business examining visibility immediately around its location needs a different configuration from one evaluating a larger service market.
If the business operates from several physical locations, separate grids may be more informative than one oversized grid that combines unrelated markets.
Choosing the Right Grid Size
Grid size determines the density of the sampled points. It does not independently determine how far the scan reaches.
For example, a 5 × 5 grid and an 11 × 11 grid can cover the same radius but provide different levels of geographic detail.
The denser grid can reveal smaller variations between sampled positions, but its usefulness depends on whether those additional measurements support a meaningful decision.
Choose the smallest grid that provides enough evidence for your purpose, then increase the detail if needed.
How Often Should You Track Rankings?
The right frequency depends on how frequently you need to make decisions.
Weekly or biweekly scans may suit campaigns that require regular monitoring. Monthly scans may be sufficient for slower-moving projects or budgets where scan costs need to be controlled.
Daily scans are not automatically better. Frequent fluctuations may be difficult to interpret without a clear reason for collecting more data.
Use a consistent schedule, document important changes, and compare results over meaningful intervals.
Balancing Tracking Detail Against Cost
The cost of a geo-grid campaign can depend on the selected tool, grid points, keywords, locations, and recurring scan schedule.
For example, increasing a grid from 5 × 5 to 11 × 11 increases the number of potential points from 25 to 121 before exclusions. If the tool charges per point, the cost can rise substantially.
Before scaling the campaign, check current pricing and credit rules. Remove irrelevant points when the tool supports that option, such as points over large bodies of water or areas outside the market you need to assess.
The best configuration balances geographic coverage, measurement detail, and the value of the decisions the data supports.
How to Read a Geo-Grid Ranking Heatmap
A ranking heatmap displays the positions recorded at individual geographic points. It helps you identify patterns that may be difficult to see from a single ranking report.
Understanding Ranking Positions and Colors
Each marker represents a sampled search location.
Depending on the tool, colors can group results into ranking ranges. For example, BrightLocal documents the following color bands for its Local Search Grid:
- Green: Positions 1–3.
- Amber: Positions 4–10.
- Orange: Positions 11–20.
- Red: Positions 21 and below.
These bands describe BrightLocal’s reporting convention, not a universal industry standard. Always consult your selected tool’s legend before interpreting a heatmap.
A strong cluster of results near the business and weaker results at the edges may indicate a geographic visibility pattern. Isolated weak points may call for a closer look at competition or measurement conditions.
Colors are useful for scanning a report quickly, but individual positions and underlying metrics provide important context.
Which Geo-Grid Metrics Matter Most?
Several measures can help you evaluate local visibility.
Metric | What it tells you | What to watch for |
Ranking position at each point | Where the business appears in the tracked results | A sampled position does not represent every search location |
Top-three coverage | The share of valid grid points where the business ranks in positions 1–3 | The result depends on which points are included |
Average grid rank | The average of the positions included under the tool’s calculation method | Missing or out-of-range results may be handled differently |
Share of Local Voice (SoLV) | A platform-defined measure of visibility against a reporting threshold | Check the provider’s formula and threshold |
Competitor visibility | Which competing businesses appear at tracked locations | A higher competitor position does not explain its cause |
Ranking change over time | How reported visibility changes between comparable scans | Changing scan settings may invalidate a direct comparison |
How to Calculate Top-Three Coverage
If your tracker does not provide a directly comparable coverage percentage, you can calculate a simple version using the valid grid points.
Formula:
Top-3 Coverage (%) = (Valid grid points ranking 1–3 ÷ Total valid grid points) × 100
For example, suppose a hypothetical scan has 25 valid grid points, and the business ranks in the top three at 10 of them.
Top-3 coverage would be:
(10 ÷ 25) × 100 = 40%
This is an illustrative calculation, not a real business result.
Define the denominator carefully. Exclude disabled points, and handle missing or out-of-range results consistently. Do not compare percentages calculated with different inclusion rules without explaining the difference.
Top-three coverage is a useful summary, but it should be examined alongside the geographic distribution of positions.
Why Average Grid Rank Alone Can Be Misleading
Average ranking position can hide important differences.
Imagine two hypothetical businesses with similar average positions. One ranks moderately well across most of its grid, while the other ranks very well in one area and poorly in another.
The averages may look similar, but the businesses have different visibility patterns and may need different strategies.
For a more complete picture, combine:
- The heatmap.
- Ranking positions at representative points.
- Top-three coverage.
- Relevant competitor results.
- Changes across comparable scans.
- Available customer interaction and conversion data.
This combination is more useful for decision-making than relying on one summary number.
How to Compare Your Business With Competitors
Use the grid to identify locations where another business appears more prominently than yours.
Investigate those locations and compare relevant information, including business categories, service relevance, profile accuracy, reputation, website content, and the competitive landscape.
A tracking tool may allow you to select a grid point and inspect the competitors appearing there. BrightLocal explains this functionality in its Local Search Grid documentation.
The purpose of competitor analysis is to identify useful evidence and potential opportunities. It is not to copy competing profiles or assume that one visible difference explains the entire ranking gap.
How to Interpret Ranking Patterns and Find Local Visibility Gaps
The most valuable part of geo-grid rank tracking is learning to investigate what the measurements reveal.
A grid shows where visibility differs. It does not automatically prove why the difference exists.
Use the patterns below as starting points for further analysis.
Observed pattern | Possible explanation | Recommended next step |
Strong rankings near the business but weaker rankings farther away | A geographic pattern that may be consistent with proximity effects | Compare the weaker areas, competitors, and actual service coverage |
Weak visibility across most grid points | A broader relevance, competitive, profile, or measurement issue | Verify the setup and assess the Business Profile, website, and competitors |
Strong results for some keywords but weak results for others | Different search intent or competitive conditions | Review keyword relevance, business services, and competing results |
A few isolated weak points | Local competitive variation, sampling differences, or an inconsistent result | Inspect those points and repeat the scan when necessary |
Competitors perform better in a particular area | A geographic competitive disadvantage | Compare relevant competitor profiles and website information |
A sudden change between scans | A possible visibility change or a difference in measurement conditions | Check the configuration, dates, business changes, and supporting data |
Investigate Weak Areas Before Making Changes
Begin with the points that matter most to your business objectives.
Inspect the same keyword and search surface, check whether the observed pattern persists, and compare the competing results.
Then look for evidence that could explain the weakness.
For example, a service business may discover that its profile information is incomplete or that the query being tracked does not closely match its actual services. In another case, the pattern may largely reflect the distance between the search point and competing businesses.
These situations require different responses.
Avoid changing profile categories, creating new pages, or modifying the business’s location information simply because a grid point has a poor ranking.
Distinguish Geographic Reach From an Optimization Problem
Not every weak grid point is an SEO failure.
A business may reasonably have weaker visibility in areas farther from its location, especially where competing businesses serve those areas more directly.
Ask whether the observed pattern conflicts with the business’s real customer base, service model, and commercial priorities.
If a weak point represents an area the business does not realistically serve, improving its ranking there may not be a meaningful objective.
If the weak area contains important customers, further investigation may be justified.
This distinction prevents businesses from chasing every ranking position instead of focusing on realistic, valuable opportunities.
How to Turn Geo-Grid Findings Into a Local SEO Action Plan
Once you understand the visibility pattern, the next step is deciding which areas require action.
Your plan should be based on evidence rather than a fixed list of tactics.
Review Google Business Profile Relevance and Accuracy
Check whether the Business Profile accurately represents the business.
Depending on the findings, review:
- Business name and core information.
- Primary and relevant additional categories.
- Available service information.
- Operating hours and contact details.
- Business location or service-area configuration, as applicable.
- Other relevant profile information.
Changes should reflect the real business and follow Google’s policies.
Do not insert extra keywords into the business name, use inaccurate categories, create fake locations, or manipulate customer reviews to chase better grid positions.
For broader guidance, explore my Google Business Profile Optimization service.
Review Website and Service Relevance
A weak ranking pattern can sometimes justify examining the website, especially when the tracked queries relate directly to important services.
Consider whether:
- Relevant services have clear, useful landing pages.
- The content satisfies the intended search query.
- Important pages are accessible through internal links.
- Business information is consistent across the website and Business Profile.
- Technical problems or content gaps may be limiting search visibility.
Location pages can be appropriate when they provide genuinely useful, differentiated information for customers. Creating near-duplicate pages for every grid point is not a sound solution.
A ranking gap alone does not prove that another landing page is needed.
Investigate Competitors and Reputation
If competitors consistently perform better in important areas, compare the evidence available for those businesses.
Assess their service relevance, categories, customer feedback, useful website content, and prominence-related signals.
Look for meaningful differences rather than treating a competitor’s position as proof of a single ranking tactic.
Reviews and online reputation should also be managed authentically. Encourage genuine customers to leave honest feedback and respond professionally, without incentives or manipulation that violate platform policies.
Prioritize Changes Using Evidence
A practical decision process is:
- Confirm that the visibility pattern is meaningful and reproducible.
- Identify the customer or business objective affected by the pattern.
- Investigate the most plausible explanations.
- Select actions supported by the evidence.
- Document what changed and when.
- Repeat the scan using comparable settings.
- Review the outcome and adjust the plan if necessary.
This approach helps separate symptoms from causes.
A well-designed Local SEO strategy should explain not just what needs attention, but why the work is justified and how its effect will be evaluated.
How to Measure Geo-Grid Progress Over Time
A single scan provides a snapshot. Repeated, comparable scans provide a stronger basis for assessing changes in visibility.
Compare Results Using Consistent Settings
When comparing scans, maintain the same:
- Keywords.
- Grid center.
- Grid size and radius.
- Valid grid points.
- Search surface and ranking depth.
- Metric definitions.
- Relevant tool settings.
Record the scan dates and note important profile or website changes.
If you change the radius or grid configuration, document the difference. You may need a new baseline rather than a direct comparison with the earlier report.
Combine Geo-Grid Results With Google Business Profile Performance
Geo-grid rankings and Google Business Profile Performance answer different questions.
A grid helps you measure where a business appears in tracked search results.
Google Business Profile Performance provides available measures of how customers discover and interact with a profile. Depending on the profile and available reporting, these can include profile views, searches, calls, website clicks, direction requests, messages, and bookings.
Use these measures to evaluate whether search visibility is accompanied by customer activity.
However, a higher ranking position does not guarantee more calls or sales. Customer demand, competition, service availability, reputation, and the quality of the business’s offering also matter.
Use Website Analytics and Search Console Where Appropriate
For businesses with websites, other data sources can provide useful context.
Google Search Console helps assess website search performance, while website analytics can help you understand visitor behavior. Appropriate call and lead tracking can help connect marketing activity to business enquiries.
Remember that conventional organic website rankings are different from geographically sampled Google Maps rankings.
Where possible, use multiple data sources to evaluate the broader picture without assuming one dataset directly proves the cause of another.
Build a Useful Local Ranking Report
A practical report should include:
- The tracking period and scan settings.
- The baseline and comparison heatmaps.
- The most important ranking and coverage metrics.
- Changes made during the measurement period.
- Relevant competitor observations.
- Available profile, website, and conversion indicators.
- The main findings and recommended next actions.
Keep the report focused on decisions. A large collection of maps and metrics is not useful unless it explains what changed, what the evidence supports, and what should happen next.
How to Choose a Geo-Grid Rank Tracking Tool
A dedicated tool can simplify the process of measuring local rankings across multiple geographic points.
Two relevant examples are Local Falcon and BrightLocal Local Search Grid.
Local Falcon
Local Falcon provides configurable map scans with different grid sizes, radii, and keyword settings. Its documentation explains how these options affect geographic detail and scan credit usage.
It may suit users who want to customize scan coverage and examine geographic ranking patterns.
Review the current Local Falcon scan configuration documentation before choosing your settings.
BrightLocal Local Search Grid
BrightLocal Local Search Grid reports local rankings from multiple points on a map and allows users to examine competitors appearing at individual points.
It can be useful for geographic visibility analysis and comparison across relevant search queries.
Review the current BrightLocal documentation to understand its reported metrics and configuration options.
What Should You Compare Before Choosing a Tool?
Before committing to a platform, check:
- Support for the specific Google search surface you need to measure.
- Available grid sizes and scan radii.
- Keyword and location limits.
- Historical reporting and scheduled tracking.
- Competitor comparison features.
- Export and reporting options.
- Definitions of average rank and missing positions.
- Credit usage, current pricing, and multi-location costs.
Do not select a tool based only on a visually appealing heatmap. Its methodology, consistency, and relevance to your business objective matter just as much.
The best tool is one that provides reliable, understandable data and supports useful decisions within your budget.
Common Geo-Grid Rank Tracking Mistakes to Avoid
Even a well-designed tracker can produce misleading conclusions if the data is used incorrectly.
Choosing an Inappropriate Radius
An overly narrow radius may miss valuable parts of the market. An excessively broad radius may include irrelevant points and dilute the analysis.
Choose the radius based on the objective, and adjust it when the baseline shows that the chosen coverage is not useful.
Changing Scan Settings Between Comparisons
If you change the keyword, radius, grid size, or search surface, the resulting reports may no longer be directly comparable.
Keep the measurement conditions consistent or explicitly establish a new baseline.
Treating Missing Rankings as an Exact Position
If a tool does not find a business within its configured ranking depth, the report may use a label or provider-specific convention to represent that result.
Do not automatically treat every missing ranking as the same numerical position across different platforms. Check how the metric is defined before calculating averages or coverage.
Relying on Average Rank Alone
An average can conceal geographic gaps and differences in ranking distribution.
Review the heatmap, representative point-level positions, coverage measures, and competitor results together.
Assuming a Heatmap Proves the Cause
Geo-grid results reveal patterns, not Google’s exact reasoning.
Investigate relevant evidence before deciding whether a visibility problem is connected to relevance, distance, competition, profile information, website content, or measurement conditions.
Trying to Rank at Every Grid Point
A business does not need to achieve the same ranking at every possible location to have a useful Local SEO strategy.
Focus on realistic customer areas and business objectives. Changes should remain accurate, policy-compliant, and supported by evidence.
Confusing Rankings With Business Growth
Ranking improvements do not guarantee more customers, revenue, or enquiries.
Use geo-grid measurements alongside suitable engagement, website, and lead data to judge whether the overall strategy is helping the business.
Frequently Asked Questions About Geo-Grid Rank Tracking
How many grid points should I use for Google Maps rank tracking?
There is no universally correct number of grid points. Choose enough to reveal meaningful differences across the area you want to measure while balancing scan detail and cost. A smaller grid may suit a compact market, whereas a denser grid may help investigate more complex visibility patterns. Start with a baseline and keep settings consistent.
How often should I track Google Maps rankings with a geo-grid?
The appropriate frequency depends on competition, ranking volatility, reporting needs, and budget. Weekly, biweekly, or monthly scans may suit different campaigns. More frequent scans are not automatically more useful. Choose a schedule that provides actionable evidence, record important optimization changes, and compare results under consistent measurement conditions.
Why do geo-grid results differ between tracking tools?
Different tools may use different search surfaces, geographic points, grid configurations, ranking depths, or methods for calculating summary metrics. Results may also differ when the measurement conditions are not the same. Before comparing tools, check their documentation and align the keyword, location settings, search surface, and metric definitions as closely as possible.
Can Google Business Profile Performance show geo-grid rankings?
No. Google Business Profile Performance provides available measures of profile discovery and customer interactions, such as views, calls, website clicks, and direction requests. Geo-grid tools measure rankings from multiple sampled locations. The two sources complement each other: one helps assess ranking visibility, while the other helps you understand how customers interact with the profile.
Does a better average geo-grid rank guarantee more leads?
No. Better ranking visibility may create more opportunities for discovery, but it does not guarantee enquiries or sales. Outcomes also depend on search demand, competition, service availability, reputation, and the quality of the customer experience. Evaluate rankings alongside suitable website analytics, profile interactions, call tracking, and lead or conversion data.
Conclusion: Use Geo-Grid Rank Tracking to Make Better Local SEO Decisions
Geo-grid rank tracking helps you understand how Google Maps visibility varies across a defined area instead of relying on one ranking position.
By choosing relevant keywords, configuring an appropriate radius and grid size, establishing a baseline, and comparing consistent scans, you can identify important visibility patterns and investigate geographic gaps.
The real value comes from what you do with the findings. Use the data to ask better questions, evaluate competitors, identify relevant optimization opportunities, and measure progress alongside customer interactions and business outcomes.
Treat each heatmap as evidence to investigate—not as proof of a ranking cause or a guarantee of business growth.
Need Help Improving Google Maps Visibility?
Understanding a geo-grid report is only the first step. The next challenge is determining which findings deserve attention and which actions are appropriate for the business.
Explore my Google Maps SEO services to learn how I approach Google Maps visibility and local search optimization. If your ranking issues may involve broader profile, website, or strategic problems, my Local SEO Audit service is another relevant starting point.
For a tailored discussion of your Local SEO needs, visit the contact page.